
In this globally outsourcing business, it'sis not a surprise to dominantly aims to cut development costs where the center is the key issues on pricing.
BPO's had been a very good leader in providing jobs and employment to most unemployed individuals who has the potential but lacks experience and confidence in battling into bigger companies with their fellow job seekers.
Since 2006 Philippines has grown 46% annually in business process outsourcing. This boom is led by demand of off-shore call centers to provide services to other big countries. Investors trusted and invested their money for Philippines has less expensive operational and labor costs, as well as an English speaking workforce as a result of having English as the second official language. English is also one of the major subjects in all educational levels.
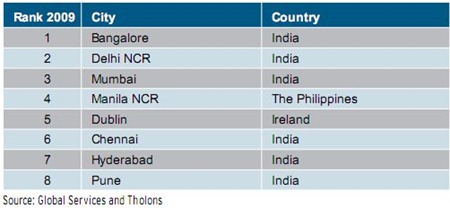
Here are some Reports on the Top Outsourcing Countries and Cities in their respective years,
2009 Rank | Top Outsourcing Nations |
1 | India |
2 | Philippines |
3 | Ireland |
4 | China |
5 | Brazil |
The Latest List of the Top Outsourcing Countries was released last Dec 20 2010...four more countries make it to the top , India maintain its position as number 1 and far way better than other countries.
Philippines in the other hand of having some political issues still maintain its position to be in the TOP 10 even though though China made it in the 2nd spot and still continues to drive outsourcing business in their country.
2010 Rank
Top Outsourcing Nations
- India
- China
- Philippines
- Ireland
- Malaysia
- Sri Lanka
- Thailand
- Vietnam
- Indonesia
- Bangladesh
- Bulgaria
- Colombia
- Mauritius
- Peru
CURRENT STATISTICS OF ALL THE NATION INCLUDED IN TOP 38
| Overall rank | Country | Overall outsourcing index | Cost competitveness index | Resources & skills index | Business & economic environment index |
|---|---|---|---|---|---|
| 1 | India | 7.1 | 8.3 | 6 | 4.2 |
| 2 | Indonesia | 6.9 | 8.6 | 4.3 | 4.4 |
| 3 | China | 6.4 | 7 | 5.6 | 5.6 |
| 4 | Bulgaria | 6.4 | 8.8 | 2.9 | 5.2 |
| 5 | Philippines | 6.3 | 9 | 2.8 | 3.9 |
| 6 | Jordan | 6.2 | 7.6 | 2.7 | 5.7 |
| 7 | Singapore | 6.5 | 6.4 | 5.7 | 9.4 |
| 8 | Thailand | 6 | 8.2 | 2.3 | 5.9 |
| 9 | Lithuania | 5.9 | 7 | 3.9 | 6.5 |
| 10 | Egypt | 5.8 | 9 | 0.9 | 4.3 |
| 11 | Malaysia | 5.8 | 7.9 | 2.2 | 6.9 |
| 12 | Estonia | 5.8 | 7.5 | 5.2 | 6.9 |
| 14 | Chile | 5.7 | 7.2 | 3 | 6.9 |
| 15 | Hungary | 5.6 | 6.9 | 3.4 | 6.3 |
| 16 | Poland | 5.6 | 6.8 | 3.6 | 5.5 |
| 17 | Czech Republic | 5.6 | 6.9 | 3.2 | 6.5 |
| 18 | Ukraine | 5.5 | 6.3 | 3.2 | 3.8 |
| 19 | Romania | 5.5 | 6.8 | 2.7 | 5.2 |
| 20 | Latvia | 5.4 | 7 | 2.7 | 5.6 |
| 21 | Pakistan | 5.4 | 6.6 | 0.8 | 3.1 |
| 22 | Vietnam | 5.4 | 7.4 | 2.5 | 4.5 |
| 22 | Argentina | 5.4 | 7.5 | 2.5 | 4.4 |
| 23 | Mexico | 5.3 | 6.9 | 2.8 | 5.3 |
| 24 | Russia | 5 | 6.4 | 3.4 | 4.7 |
| 25 | Israel | 4.9 | 3.8 | 5.5 | 7 |
| 26 | Ghana | 4.9 | 7.5 | 0.9 | 4.3 |
| 28 | Canada | 4.8 | 2.5 | 6.3 | 8.3 |
| 29 | Costa Rica | 4.8 | 7.3 | 2.3 | 4.8 |
| 30 | South Africa | 4.6 | 6.9 | 0.6 | 6.3 |
| 31 | Jamaica | 4.5 | 6.2 | 3.7 | 4.7 |
| 32 | Kenya | 4.5 | 6.7 | 1.3 | 3.6 |
| 32 | Panama | 4.4 | 5.8 | 1.9 | 5.6 |
| 33 | Senegal | 4.3 | 7.1 | 0.2 | 3.3 |
| 34 | United States | 4.2 | 1.7 | 6.9 | 8.3 |
| 35 | United Arab Emirates | 4 | 2.8 | 4.7 | 7.9 |
| 36 | Tunisia | 3.9 | 4.7 | 1.9 | 6.3 |
| 37 | Brazil | 3.6 | 4.3 | 2.4 | 4.1 |
| 38 | Sri Lanka | 3.5 | 8.3 | 1.2 | 4.3 |
No comments:
Post a Comment